
Artist Revenues
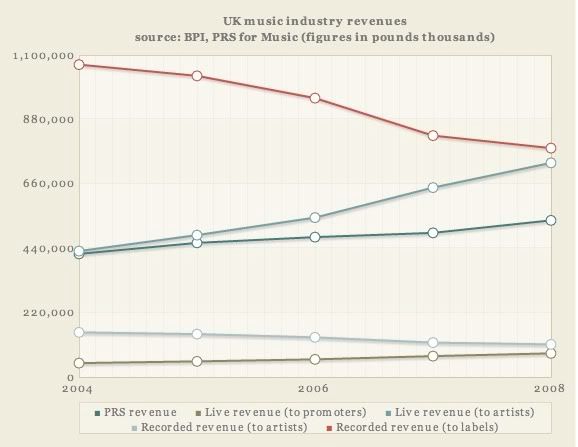
TimesOnline: “This is the graph the record industry doesn’t want you to see.
“It shows the fate of the three main pillars of music industry revenue – recorded music, live music, and PRS revenues (royalties collected on behalf of artists when their music is played in public) over the last 5 years.
“…two things clear: one, that the growth in live revenue shows no signs of slowing and two, that live is by far and away the most lucrative section of industry revenue for artists themselves, because they retain such a big percentage of the money from ticket sales.”
As Billboard noted here, I’d also like to see a chart like this that excludes the top dogs.
“In 1982, the top 1% of artists took in 26% of concert revenue; in 2003 that figure was 56%. … The top 5% of revenue generators took in 62% of concert revenue in 1982 and 84% in 2003. Surely, this is a market where superstars receive the lion’s share of the income.”